






- Summary
- Workplace analytics software collects occupancy, presence, attendance, and booking data from badge, Wi-Fi, sensor, and desk-booking sources.
- Five core metrics (occupancy rate, utilization rate, peak occupancy, attendance rate, and cost per seat) inform space-planning, hybrid/RTO policy, and resource-allocation decisions.
Leases, space planning, and hybrid policies are among an office’s largest commitments, and many are still decided on assumptions about who comes in and when. A static headcount no longer serves the average office. When and where we work has been significantly impacted by the increase of hybrid offices, RTO policies, and flexible workplaces. Workplace analytics software gives you far more detail about workplace behavior, providing occupancy, utilization, presence, and booking data that show how the office is actually used.
Demand for this software is growing, with Insight Partners predicting the workplace analytics market will reach $351m by 2034. Office managers and leadership teams use it to make three kinds of decisions:
- Space planning and real estate: Occupancy and utilization data show how many square feet you need and whether to consolidate locations.
- Hybrid and RTO policy: Attendance data shows adherence to in-office guidelines and how to structure collaboration around peak days and trends.
- Resource allocation: Day-to-day occupancy data aligns desks, rooms, and meeting spaces with actual demand.
Which of the three decisions are you trying to solve? Let’s get into the data you may need and the platform that will help answer your questions.
What is workplace analytics software?
Workplace analytics software is any software that collects and analyzes occupancy, presence, and booking data to report how office space is used. More advanced workplace analytics platforms combine actual occupancy data with booking and reservation data. This reveals discrepancies such as unused reservations, meeting-room no-shows, underutilized spaces and areas in-demand.
These kinds of data can get confused, so to separate:
Occupancy data measures the use of desks, meeting rooms, floors and buildings. It helps organizations understand when spaces are occupied and how specific areas are being used.
Presence and attendance data measures whether employees are in-office – methods of tracking employee attendance vary in accuracy, some will show daily presence, others provide exact arrival and departure times.
Since a single layer of data alone won’t tell you the story you need, I would advise that you set your standards for workplace analytics software high: consistently structured dashboards, site-level comparison across locations, department level views, and (above all) accuracy.
Which workplace analytics tools are best for hybrid and RTO offices?
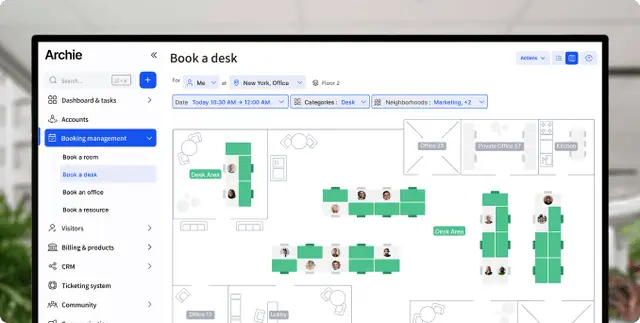
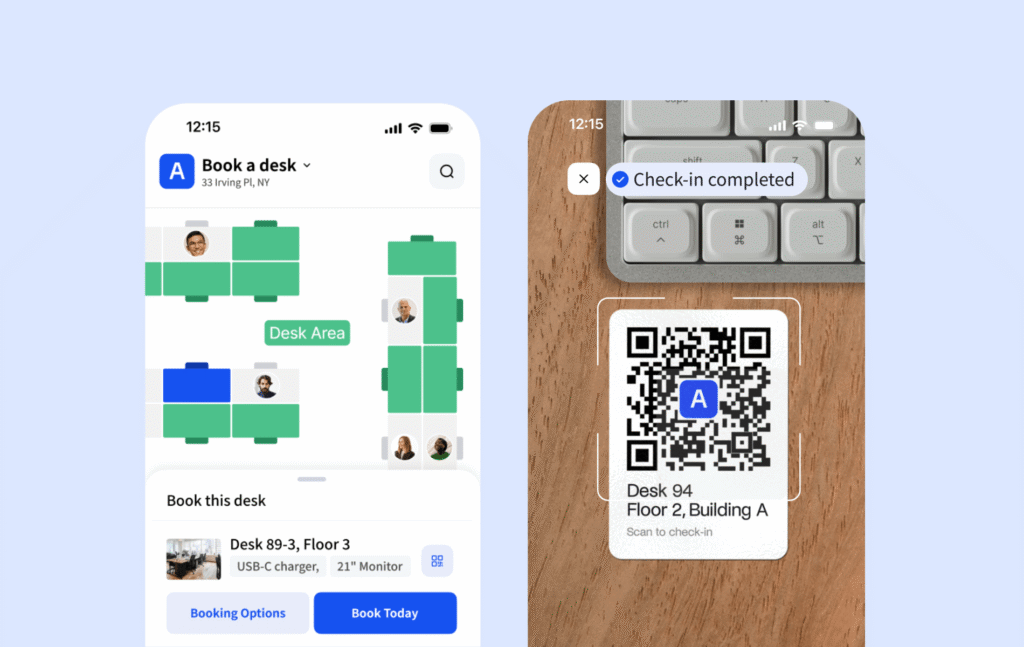
The best workplace analytics tools for hybrid and RTO offices are Archie, Robin, and OfficeSpace Software for software-led analytics without proprietary sensor hardware and VergeSense and Density for sensor-based occupancy data. Archie combines a popular desk booking solution (4.9/5 on G2) with Wi-Fi, badge, and occupancy data for hybrid scheduling and space planning.
Platform | What it tracks | Deployment | Privacy | Hybrid support |
|---|---|---|---|---|
Archie | Occupancy rate, peak usage, and utilization from IP and Wifi attendance detection, badge, and desk-booking data | Pure cloud SaaS; no proprietary sensor hardware | SOC 2 Type II and GDPR compliant | Combines several presence sources for hybrid scheduling and space planning |
VergeSense | Computer-vision sensors detect utilization and space-type usage (collaborative vs. focus), | On-site sensor hardware plus a cloud platform | SOC 2 Type II, ISO 27001, and GDPR compliant | Space-type data informs hybrid-policy and layout decisions |
Density | Radar-based sensors detect occupancy and meeting-type counts (1:1 vs. group) | Self-installable sensor connected to a cloud dashboard | Claims anonymity at the point of collection | Informs return-to-office and hybrid-policy decisions |
OfficeSpace | Occupancy rate, peak usage, and utilization from Wi-Fi, badge, and desk-booking data | Cloud software integrates with third-party sensors (e.g., VergeSense) | Publishes no certifications | Combines several presence sources for hybrid scheduling and space planning |
Robin | Occupancy, space utilization, collaboration patterns & trends | Pure cloud SaaS; no proprietary sensor hardware | Choice between US or EU data residency | Informs layout changes and hybrid-policy adjustments |
What should office managers and executives look for in a workplace analytics platform?
Office managers and executives should evaluate a workplace analytics platform on 4 criteria (data quality, employee privacy, integration breadth, and reporting clarity).
- Data quality: Data quality determines the workplace analytics software’s accuracy. Unreliable badge, Wi-Fi, or sensor data produces misleading utilization charts. This also leans into software flexibility and how the data is presented: if you’re stitching multi-source data together by hand, you’re already paying for the platform’s weakness.
- Employee privacy: Employee privacy requires distinguishing aggregated, team-level analytics from real-time individual monitoring. A compliant workplace analytics platform can show you occupancy patterns without per-person activity data, if that’s what you need.
- Reporting clarity: Look for dashboards that generate themselves and can be tailored to each audience, with export, segmentation, and drill-down from portfolio total to building to floor.
- Integration breadth: Integration breadth connects the workplace analytics platform to calendars, collaboration tools, HR information systems, and desk booking software or room booking software. Disconnected systems leave workplace data fragmented and unreliable.
Large multi-site organizations lean hardest on three features: site-to-site comparison, dashboards built the same way everywhere, and department- or executive-level views cloned from a shared one.
Increasingly, reporting dashboards now add natural-language query interfaces. This lets a non-technical executive ask a question about utilization or occupancy and get an answer directly.
How do hybrid office policies change workplace analytics software needs?
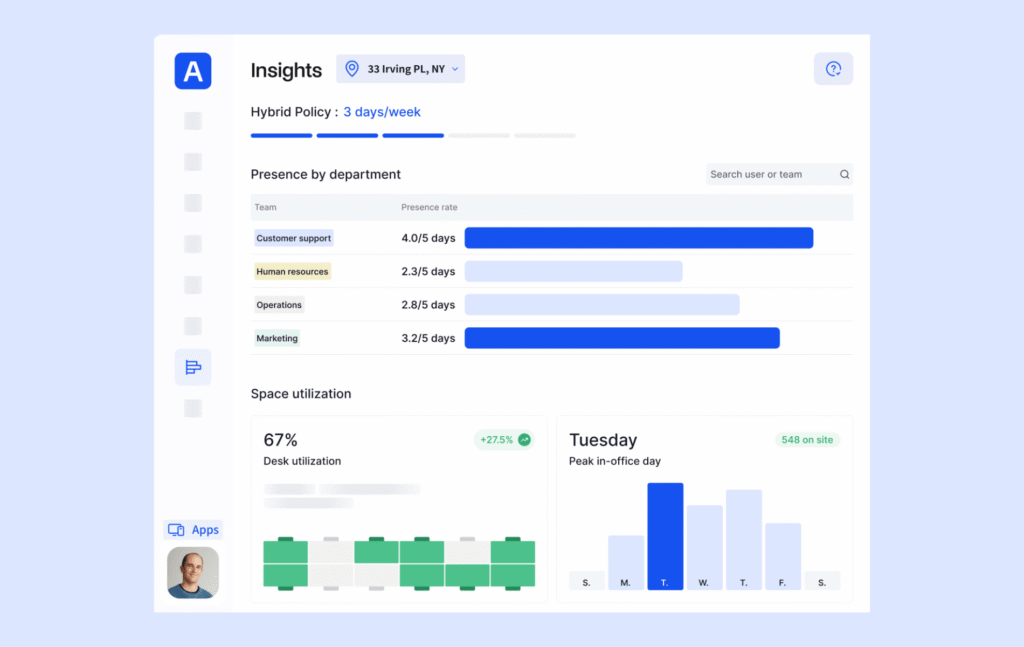
Hybrid office policies shift workplace analytics software from static headcount to attendance patterns by day of the week and by team. When employees cluster their office days, organizations need to know not only how many people come in, but when they come in and which teams are present. This is exactly what effective workplace analytics tools report.
Patterns differ by working model. Fully in-person schedules produce fairly consistent occupancy across the week, and fully remote arrangements produce little to no office use. Hybrid schedules typically peak between Tuesday and Thursday and dip on Mondays and Fridays, unless the organization sets team or company-wide office days.
One office tracked in OfficeRnD’s 2026 Hybrid Work Policy Guide recorded 73.3% occupancy on Mondays against 36.2% on Fridays.
Remember that attendance rate and peak occupancy measure different things. One is about in-office adherence and the other speaks to real-estate and space planning decisions.
Attendance rate shows whether employees meet their mandated weekly office-attendance target, using badge or other presence data, so it measures policy compliance. Peak occupancy and space utilization against capacity benchmarks show how effectively the office space is used, which is what strategic workplace planning relies on.
How do workplace analytics tools measure office utilization for hybrid teams?
A good tool measures utilization against each employee’s expected schedule, not one building-wide number. Any average numbers miss the point, which is daily, or perhaps hourly, specifics.
These four sources are the most common:
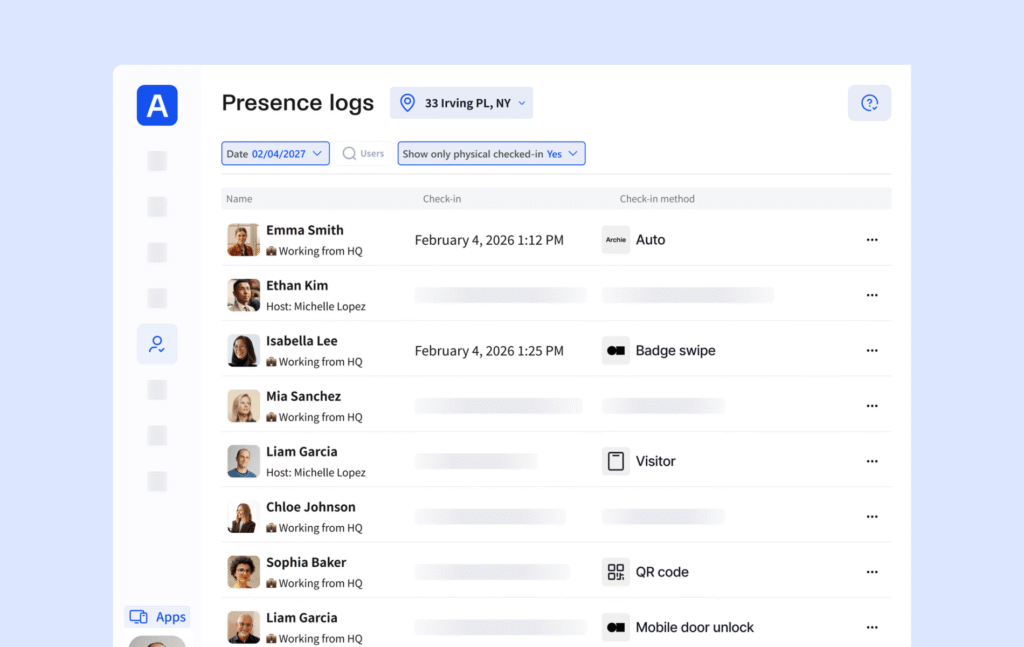
- Badge data (fobs, swipes, mobile credentials) logs who entered and when. However, it says nothing about how long they stayed or where they went.
- Wi-Fi or IP detection data infers presence from a device connecting, or from a mobile app checking location. The most reliable form is IP detection from company laptops (like Archie Presence), whereas relying on employee mobile devices means that accuracy depends on regular background refreshes.
- Sensor data (infrared, ultrasonic, camera-based) detects real use at desks, rooms, or zones by individual sensors. That said, it is the most costly in terms of hardware and hardware maintenance, and is prone to false readings.
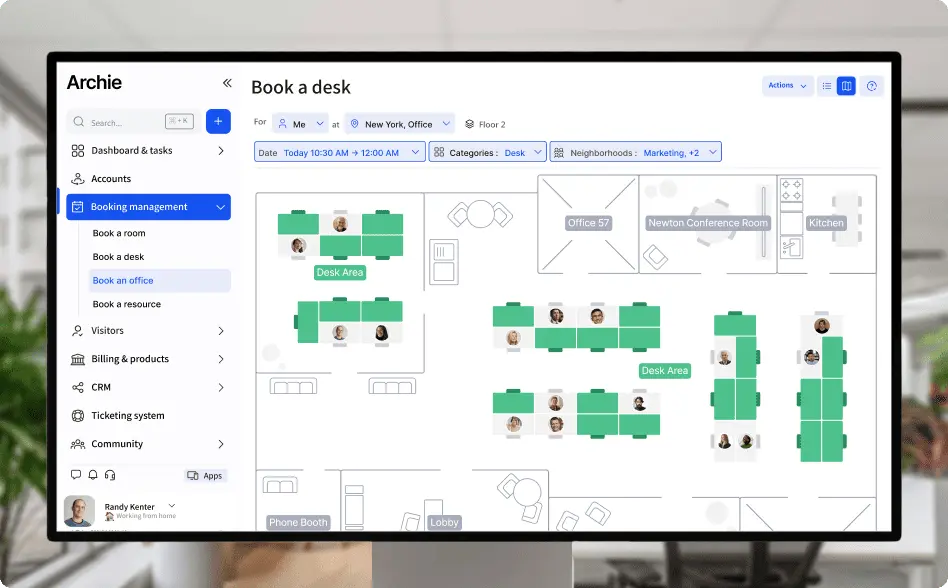
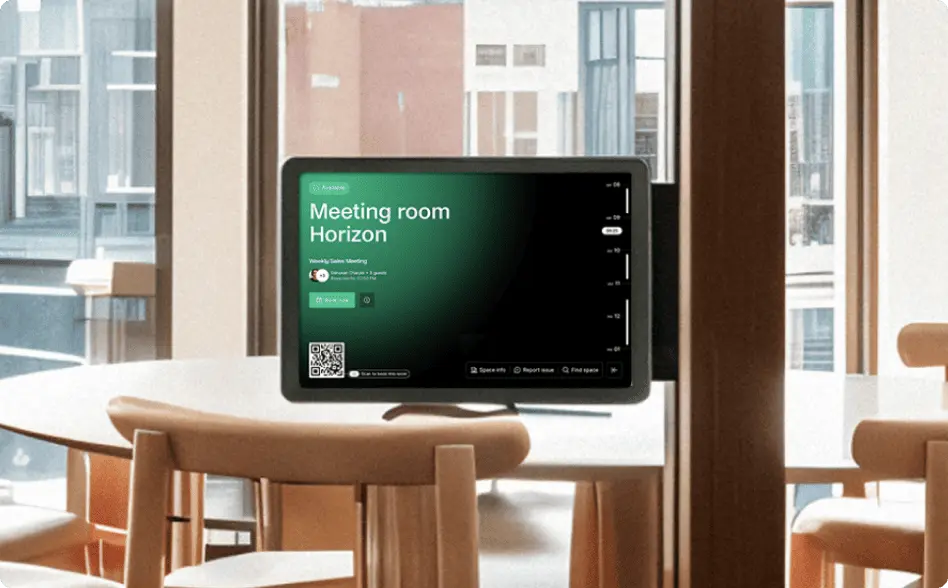
- Booking data from desk and room reservations forecasts expected occupancy. This one can be less reliable as a full measure, for which I recommend you have set booking policies so that check-in data captures true utilization instead of intended.
If you don’t yet have an access control system that involves badge swipes or sensors, the hardware necessary is a significant consideration.
What to expect
CBRE’s hybrid workplace analysis suggests that sustained vacancy rates above 30%, combined with low peak-day congestion, may indicate an opportunity to consolidate office space. Conversely, when peak occupancy consistently exceeds 80% of capacity, it may signal overcrowding. This is a signal that you need to renew or review space allocation, floor layouts and building capacity.
Workplace analytics benchmarks and guidelines
Occupancy rate, utilization rate, peak occupancy, attendance rate and space-efficiency rate are all valuable workplace analytics metrics for offices. Together they cover how full the office is, how well it’s used, how crowded it gets, whether people are following policy, and what each seat costs.
- Occupancy rate is the share of desks or space in use at one moment: (occupied ÷ total available) × 100.
- Utilization rate is the same idea stretched over time: (average daily occupancy ÷ total available capacity) × 100, or an hours-based version. Upflex’s 2026 benchmarks put average utilization at 60-70%, with 70-80% cited as optimal.
- Peak occupancy is the highest headcount a space reaches in a defined period, such as a day. Worklytics’ 2025 data flags peaks that sit consistently above roughly 80% of capacity as a congestion risk.
- Attendance rate compares actual in-office days with the mandated minimum. RTO policies can set the required level, and this metric tells you whether anyone is meeting it. CBRE’s 2026 Americas Office Occupier Sentiment Survey shows US employers averaging a 3.2-day weekly target against 2.9 days of actual attendance.
- Space-efficiency (cost per seat) is annual cost per workstation. Matterport’s office space planning research puts it at roughly $10,000-18,000 in tier-1 urban markets, $6,000-10,000 in tier-2 cities, and $4,000-7,000 in suburban or satellite offices.
In practice, these metrics are split between teams. Operations and facilities live in utilization and occupancy, because that’s what decides desk and room counts. HR operations take the attendance rate. Executives will roll cost per seat up across locations to defend, or shrink, the real estate portfolio.

Which workplace analytics software should you choose?
Start with the question you need answered.
Have you just implemented an RTO policy and want to track adherence? Or is resource allocation a priority? Pick the priority data source and consider how each platform measures it with the least hardware and privacy overhead.
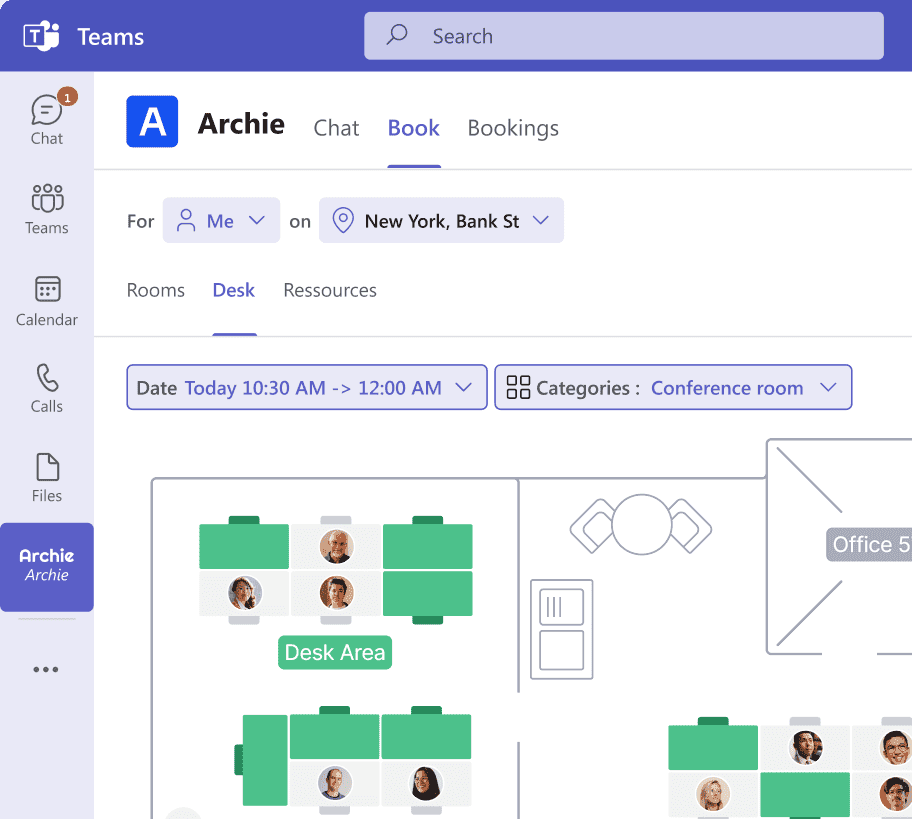
Archie provides comprehensive workplace analytics with pure cloud SaaS. There’s no proprietary sensors, instead Archie combines Wi-Fi, badge, and desk-booking data for occupancy, peak usage, and utilization. Archie Presence uses IP detection from company laptops for presence tracking. It is SOC 2 Type II and GDPR compliant.