


- What you’ll learn
- What coworking space KPIs are and why they matter
- Which KPIs every coworking operator should track first
- How to calculate metrics like occupancy rate, RevPAD, utilization, MRR, ARPU, churn, and lead conversion
- How to choose the right KPIs based on your business goals
- How coworking software like Archie can make reporting easier and more accurate
Running a coworking space means juggling a lot of moving parts. Think pricing, tours, staffing, marketing, member retention…
Coworking space KPIs are the simple numbers that keep all of that on track. And luckily, you don’t need to track everything. In this guide, we’ll keep it simple with clear formulas, quick examples, and expert input from David Walker.
When you’re ready, let’s start with the basics.
What are coworking space KPIs?
Coworking space KPIs are the key numbers that show how your space is doing. They help you track goals like filling more desks, earning more from meeting rooms, and keeping members longer.
If you measure them regularly, you can see what’s working and what to address next. But what exactly should you track?
Examples of coworking space benchmarks & KPIs to measure
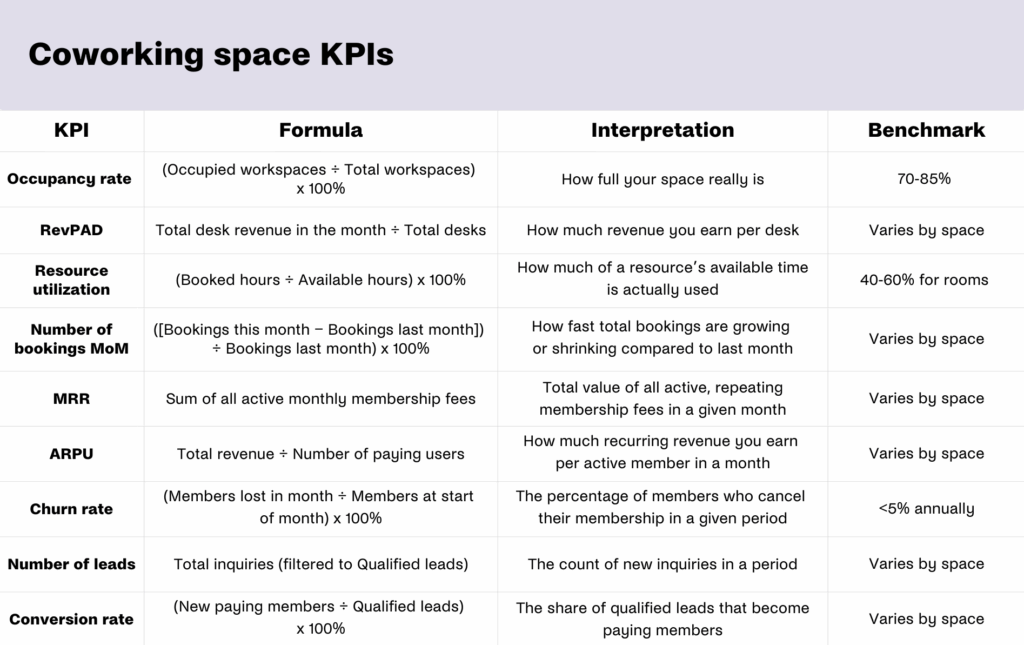
Occupancy rate
A coworking space’s occupancy rate tells you how full your space really is. You can measure it for the whole site or by workspace type (desk occupancy, meeting room occupancy, private office occupancy, etc.).
It’s the simplest health check for demand and pricing. You get it by dividing the number of occupied spaces (desks, meeting rooms, etc.) by the total number of available spaces and multiplying by 100:
🟰 (Occupied workspaces ÷ Total workspaces) x 100%
Quick example: You have 150 desks and 120 are taken on average this month. This means: 120 ÷ 150 = 0.80 → 80% desk occupancy rate.
Many operators treat 70–80% average occupancy as a healthy target. Above 85% is great, but it can create waitlists and push people into rooms that do not quite fit their needs. Always compare against your own history and local market!
How to improve your coworking occupancy rate
- Fix the mix. If small private offices have a waitlist while hot desks sit open, convert some area to smaller offices or more dedicated desks.
- Fill short gaps. Use day passes, short-term offices, or corporate bundles to backfill between move-outs and move-ins.
- Reduce “ghost” holds. Require quick check-ins for rooms and auto-release no-shows so real demand can book.
- Attract more members. Rethink your coworking space marketing efforts and membership options to keep workspaces occupied.
⚠️ Make sure not to count blocked space as “available,” change your method mid-year, or rely only on the total occupancy number. Always segment by product type and compare this month to the same month last year to handle seasonality.
Revenue per available desk (RevPAD)
RevPAD shows how much revenue you earn per desk, per month, counting every desk in the space, even the empty ones.
Occupancy alone can look great while discounts quietly drag revenue down. Price alone can look high while empty seats kill coworking space profitability. RevPAD connects the dots between how full you are and what you actually earn.
🟰 Total desk revenue in the month ÷ Total desks
Quick example: If desk revenue this month is 45,000 USD and you have 150 desks, your RevPAD is 300 USD. This means your coworking space is generating, on average, 300 USD per desk in the space each month.
There is no single “good” RevPAD because it depends on your city and your mix. As a sense check, compare RevPAD to local membership prices. In many U.S. markets, open workspace plans cluster around $150/month and dedicated desks around $300/month, with higher prices in big cities. Use those as rough guardrails and focus on your trend by location.
How to improve your coworking RevPAD
- Tune pricing to real demand. Review the list vs the realized price each quarter. Adjust by zone or floor, test small increases, and retire “forever” discounts so rates don’t drift.
- Rework the layout. If private offices or dedicated desks have a waitlist while hot desks sit open, convert underused areas to smaller offices or more dedicated desks that sell faster.
- Package smart add-ons. Bundle desk & meeting room credits, lockers, mail handling, or printing tiers into clear good-better-best plans. Bundles help you increase revenue without changing your coworking space floor plan.
⚠️ Make sure you use desk revenue only — exclude one-time setup fees, deposits, and meeting room sales. If you do include day-pass income, write that rule down and keep it consistent.
Resource utilization
Resource utilization shows you how much of a resource’s available time is actually used. You can track it for meeting rooms, phone booths, studios, hot desks, and shared equipment.
It reveals idle capacity, wrong room sizes, and booking friction you can fix quickly. It also helps you identify misfits like 8-person rooms used by two people most of the time.
🟰 (Booked hours ÷ Available hours) x 100%
To count available hours, multiply the number of resources × hours open per day × business days in the period. If a room is offline for cleaning or maintenance, remove those hours so the metric stays accurate.
Quick example: 540 booked hours ÷ 880 available hours = 61% utilization
A practical target for average meeting room utilization is 40 to 60%. Phone booths and small rooms often run higher, while large boardrooms are usually lower unless you host lots of workshops.
How to improve your coworking resource utilization
- Right-size the mix. If most meetings are 1–3 people, convert large rooms into small rooms or add phone booths.
- Tighten bookings. Reduce default meeting lengths, offer 25 or 50 minute slots, and add buffers only where needed.
- Cut “ghost” bookings. Require quick check-ins and auto-release no-shows.
- Use peak and off-peak pricing. Encourage demand to spread into quieter hours.
- Audit recurring meetings. Cancel or resize recurring meetings that never happen or use only a fraction of the seats.
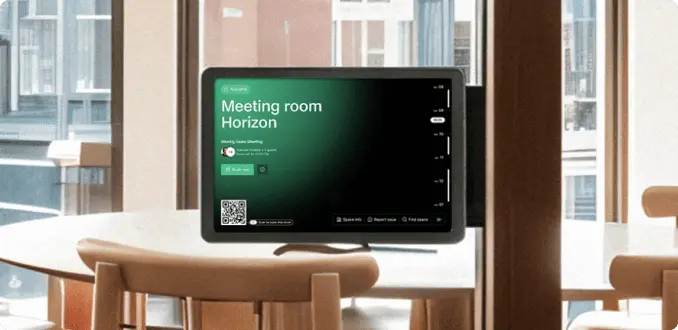
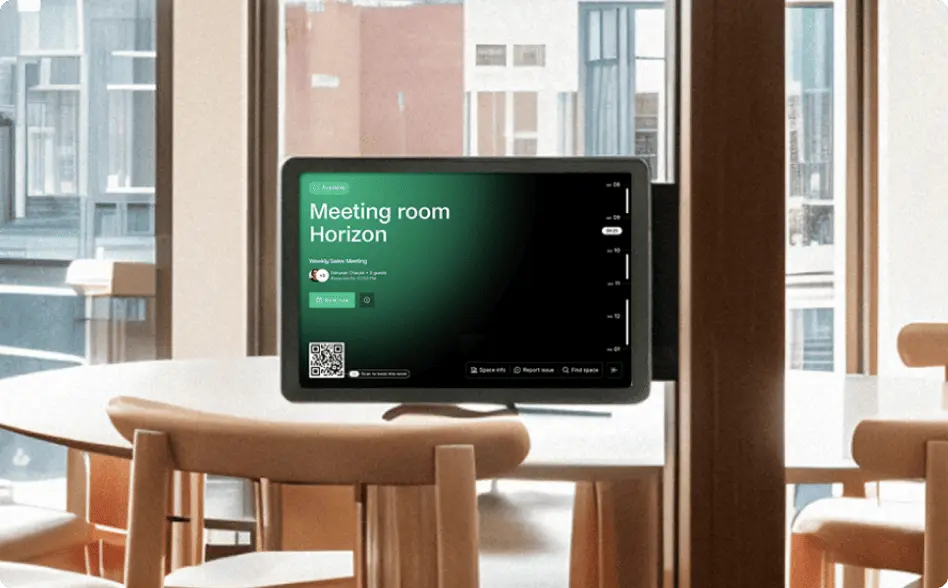
- Show live availability. Screens and live maps reduce hunting and improve turnover between meetings.
⚠️ Track utilization separately for booths, small rooms, and large rooms to see what really needs attention. Do not count maintenance or event blocks as available.
Number of bookings MoM (month-over-month)
MoM bookings tell you how fast total bookings are growing or shrinking compared to last month. You can include meeting rooms, day passes, hot desk reservations, and any other bookable items that matter to your revenue.
Bookings usually move before revenue does, so it’s a simple way to see demand trends early. When bookings rise, you can expect higher utilization and room revenue soon after. When they dip, you get an early warning to adjust pricing, run a campaign, or shift inventory.
🟰 ([Bookings this month − Bookings last month]) ÷ Bookings last month) x 100%
Quick example: You had 1,000 bookings last month and 1,200 this month, which means (1,200 − 1,000) ÷ 1,000 = +20% MoM
MoM booking growth can be very seasonal. New locations often see double-digit MoM increases in the first few months as awareness builds. Mature sites typically track single-digit changes and follow local seasonal patterns. Use your own 3-month moving average as a baseline, and compare this month to the same month last year for a fair view.
How to improve your coworking space bookings MoM
- Make booking simple. Shorten forms, show real-time availability, and keep “Book now” visible on your coworking space website.
- Speed up repeat bookings. Add one-click rebook links in emails and “Book again” buttons in member portals.
- Tune pricing by time. Use peak and off-peak rates to spread demand into quieter hours.
- Improve findability. Add clear maps and filters to your site, keep your Google Business Profile updated, and ensure your meeting room pages include good photos, accurate capacity, and listed amenities.
⚠️ Count completed bookings only. Exclude cancellations and no-shows. If you allow recurring series, count each actual occurrence that happened this month. Keep your rules the same every month so the trend stays clean.
Monthly recurring revenue (MRR)
MRR is the total value of all active, repeating membership fees in a given month. It includes hot desks, dedicated desks, private offices, mail plans, and any other recurring add-ons. It excludes one-time items like deposits, setup fees, day passes, and ad-hoc meeting room bookings.
Why does it matter? MRR simply means predictable cash for hiring, marketing, and expansion. It also gives early warning on pricing, discounts, and churn, plus a clear view of which plans and locations really drive the business.
🟰 Sum of all active monthly membership fees
Quick example: 320 members × 190 USD monthly fee = 60,800 USD MRR
⚠️ Useful MRR variations:
- New MRR: MRR from brand-new memberships started this month
- Expansion MRR: Extra MRR from upgrades
- Contraction MRR: Lost MRR from downgrades
- Churned MRR: Lost MRR from cancellations
How to improve your coworking space MRR
- Reduce churn. Offer better onboarding, pause options, save offers, and quick fixes to top complaints.
- Recover failed payments. Use card updater, smart dunning emails, and a backup payment method.
- Fill gaps faster. Pre-lease offices, offer flexible start dates, and keep waitlists for high-demand plans.
- Offer annual terms. Optional annual prepay with a modest incentive improves commitment. Recognize it monthly in MRR.
Member ARPU (average revenue per user)
ARPU shows how much recurring revenue you earn per active member in a month. It rolls pricing and discounting into one simple number, shows if add-ons and upgrades are working, and reveals discount leakage when ARPU drifts below your price sheet.
🟰 Total revenue ÷ Number of paying users
Quick example: If you have 60,800 USD of revenue and 320 active members in a given month, your ARPU is 190 USD.
There is no universal ARPU for coworking. Cities, mixes, and plans vary a lot. Track ARPU by plan type and location, compare it to your list price, and watch the trend month over month and year over year.
How to improve your coworking space ARPU
- Create tiered plans. Make upgrades the obvious choice and use simple side-by-side comparisons so people see what they get by moving up a tier.
- Set minimum terms for private offices. Offer 3, 6, and 12-month options with small price breaks for longer terms. This keeps yield stable and reduces churn noise.
- Offer team add-ons and corporate packs. Bundle the things teams care about: extra meeting room credits, guest passes, printing, phone booths, and so on.
A simple what-if scenario: If ARPU rises from 190 USD to 205 USD on 340 members, MRR lifts by 5,100 USD a month without adding new members.
Member churn rate
Member churn rate is the percentage of members who cancel their membership in a given period. Track it every month and split it by plan type, because hot desks behave differently from private offices.
🟰 (Members lost in month ÷ Members at start of month) x 100%
Quick example: 20 members lost ÷ 400 starting = 5% churn
The aim is to keep it as low as possible; less than 5-7% annually would be ideal. Small changes in churn ripple through your whole coworking business, for example:
- At 5% churn, about 54% of the cohort is still with you after 12 months.
- At 3% churn, about 69% remain after 12 months.
How to improve your member churn rate
- Make the first month smooth. Pay attention to your coworking space onboarding process. You could send a friendly day-1 checklist, do a quick “make the most of your membership” call in week one, and nudge first bookings for rooms and booths so people build routines.
- Spot early warning signs. Watch for fewer check-ins, fewer bookings, or payment retries.
- Run save plays. Offer a pause instead of a cancel. Provide a downgrade path when the budget is tight.
- Fix the top two causes of member churn. For example, if noise and call privacy are common complaints, add phone booths. If Wi-Fi or printing causes friction, fix it fast and tell members you did. Close the feedback loop so people see action.
- Invest in your coworking space community. Simple monthly events, member spotlights, and clear etiquette make the space feel welcoming. Belonging reduces churn.
⚠️ Count a member as “lost” on their actual end date, not when they give notice. Exclude paused accounts if they are still paying a reduced fee. Use the same “start of month” count each time to stay consistent.
Number of leads
To put it simply, it’s the count of new inquiries in a period. Leads are the top of your funnel, and more good leads usually turn into more tours and signups next month. A sudden dip in leads is an early warning to update offers, fix your site, or adjust ads.
🟰 The number of inquiries in a given period of time
You can track Total inquiries, and then filter to Qualified leads so quality stays visible. “Qualified” means the person has real intent and enough info for you to follow up. Write your definition down and use it every month, for example:
- A completed “Book a tour” form with name, email, company size, target move-in date, and plan interest
- An inbound call or chat where budget and timing are confirmed
- A broker introduction with a defined seat count and move-in window
Quick example: You received 150 inquiries in June. After filtering spam and partial forms, 113 met your rules, which is the number of qualified leads.
How to improve the number of your coworking space leads
- Invest in your online presence. More (qualified) visitors usually mean more real leads. Tools like Google Analytics and Semrush’s website traffic checker offer a free way to monitor this metric.
- Make it easy to reach you. Have a visible “Book a tour” button on every key page, enable fast site speed, short forms, and auto-fill options.
- Show coworking space amenities that matter. Think phone booths, parking, 24/7 access, dog-friendly workspaces, and so on.
Lead conversion rate
In other words, the share of qualified leads that become paying members. Track your conversion rate to see if your offer and pricing are working for people who are interested in joining your space.
🟰 (New paying members ÷ Qualified leads) x 100%
Quick example: 35 new members ÷ 140 qualified leads = 25% conversion
A steady lead volume with falling conversion means your message, price, or process is off. A rising conversion with flat leads often signals a good fit and better execution. It is one of the fastest ways to forecast next month’s signups.
How to improve your coworking space conversion rate
- Remove friction. Offer one-click tour bookings, reschedules, calendar invites, automated reminders, and flexible start dates.
- Run tight tours and proposals. Follow a simple tour flow and send a same-day proposal with e-signature and a precise hold date.
- Offer member-only value. Add member pricing and simple bundles like room credits, lockers, and mail service to sweeten the deal.
- Use your platform to nurture leads. Track every lead in your coworking CRM system like Archie, set automatic reminders, and send short follow-ups after tours.
⚠️ To count it cleanly, make sure to define qualified once and use it every month. Be consistent.
Choosing which coworking space KPIs to track
Picking coworking space KPIs is easier when you start with goals. Choose one or two goals for the next quarter, then pick a small set of KPIs that prove you are moving in the right direction. Keep the list stable for at least one quarter so you can see real trends!
Step 1: Start with clear goals
Write down the outcomes you want, for example:
- Filling underused desks. You want more seats taken and a better yield per seat.
- Growing meeting room revenue. You want rooms used more often and at a better rate.
- Improving retention. You want members to stay longer and spend a little more over time.
Step 2: Map goals to KPIs
For each goal, pick one primary KPI and two or three supporting metrics.
- Filling underused desks
- Primary: Occupancy rate
- Supporting: RevPAD, Number of leads, Lead conversion rate, ARPU
- Growing meeting room revenue
- Primary: RevPAR for rooms (room revenue per available hour)
- Supporting: Resource utilization, Average price paid per hour, No-show rate
- Improving retention
- Primary: Member churn rate
- Supporting: LTV, MRR growth, Member satisfaction (NPS or CSAT), Involuntary churn from failed payments
Step 3: Make the numbers trustworthy
Decide your counting rules once and write them down. Keep the formulas simple and visible in your doc so everyone in your team calculates the same way.
- Use recurring revenue only when you calculate MRR, ARPU, and LTV.
- Count completed bookings for utilization and MoM bookings. Exclude cancellations and no-shows.
- For churn, count on the actual end date. Exclude paused accounts that still pay.
- Segment by plan type and location. A single blended number hides problems.
- Compare this month to the same month last year to handle seasonality. A 3-month moving average helps smooth noise.
Step 4: Involve your team
Your KPIs only help if the whole team uses them. Community managers are closest to members, tours, and day-to-day issues, so they are your best source of truth. Give them clear ownership, a powerful coworking tech stack, and specific tasks so numbers turn into actions.
As David Walker, Owner of CoworkingConsulting.com & Founder of Coworking Ecosystem Network, puts it:
Most people don’t become community managers because they’re passionate about KPIs. They’re motivated by people, not spreadsheets. Owners, on the other hand, live and breathe the numbers: occupancy, churn, revenue. The opportunity is to bridge those two worlds by reframing coworking space KPIs so they aren’t seen as cold performance measures, but as reflections of how well the community is thriving.
- David Walker
- CoworkingConsulting.com
His advice is to invite staff to coworking space KPIs conversations in a transparent, culture-driven way. This way, the numbers stop being pressure points and start becoming a shared language that aligns member experience with the health of the business.
- Explain why each KPI matters in plain language. For example, occupancy tells us if people see enough value to commit. Churn shows us if members are happy enough to stay. Leads and conversions show if we’re good at selling our offers.
- Give community managers clear tasks. For example, ask them to log tour outcomes and the top two objections heard this week. Or, watch early warning signals such as fewer check-ins or bookings, then start a friendly outreach.
- Build a lightweight dashboard that everyone uses. Use one page that shows all the relevant coworking space KPIs. If you’re already using coworking space software to manage daily operations, you can easily use it for reporting & analytics.
Which brings us to the next point:
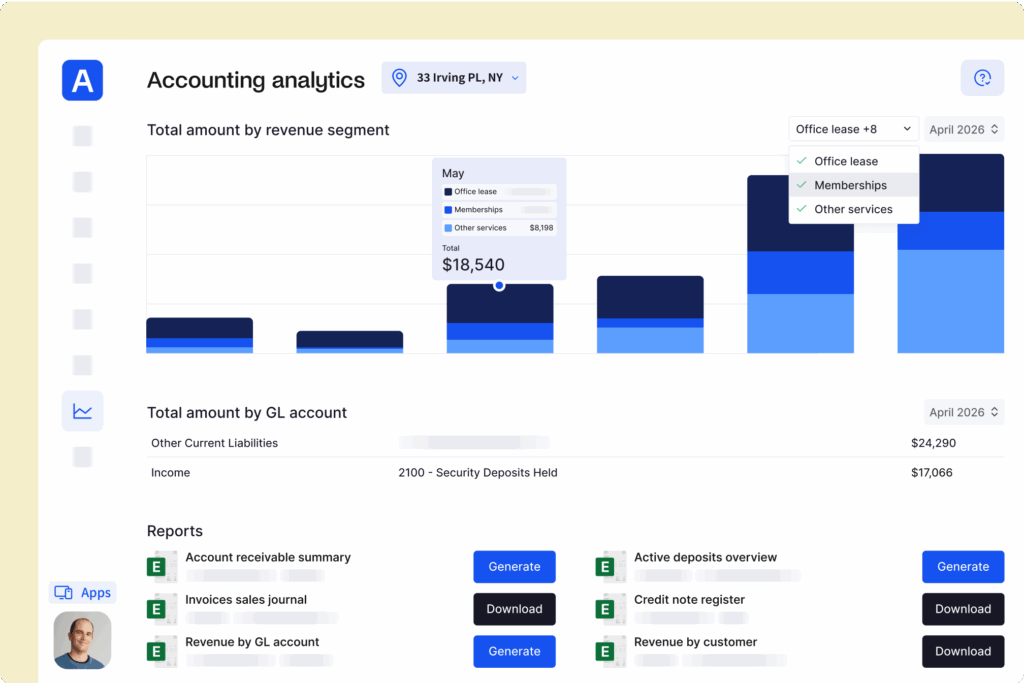
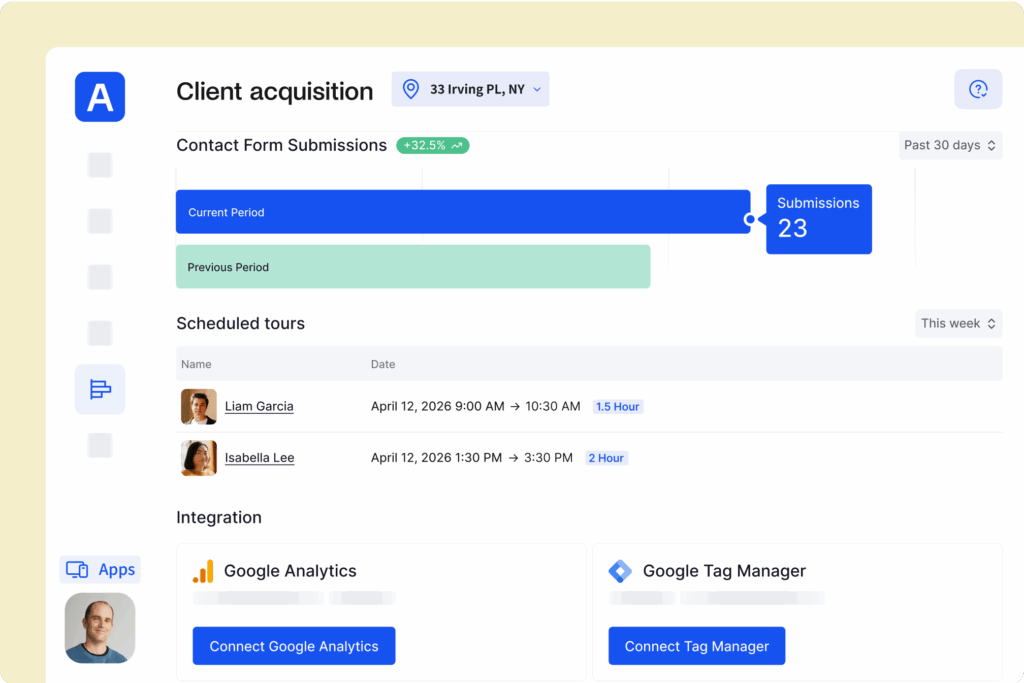
Step 5: Use your coworking space management software
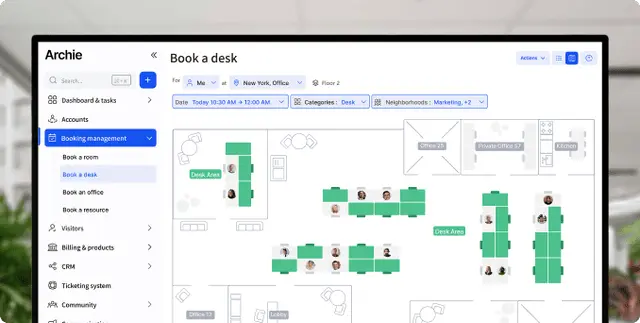
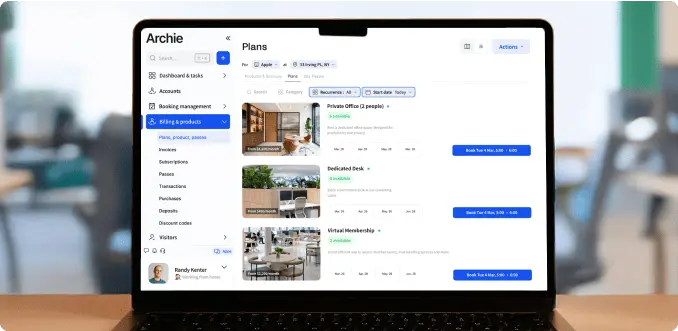
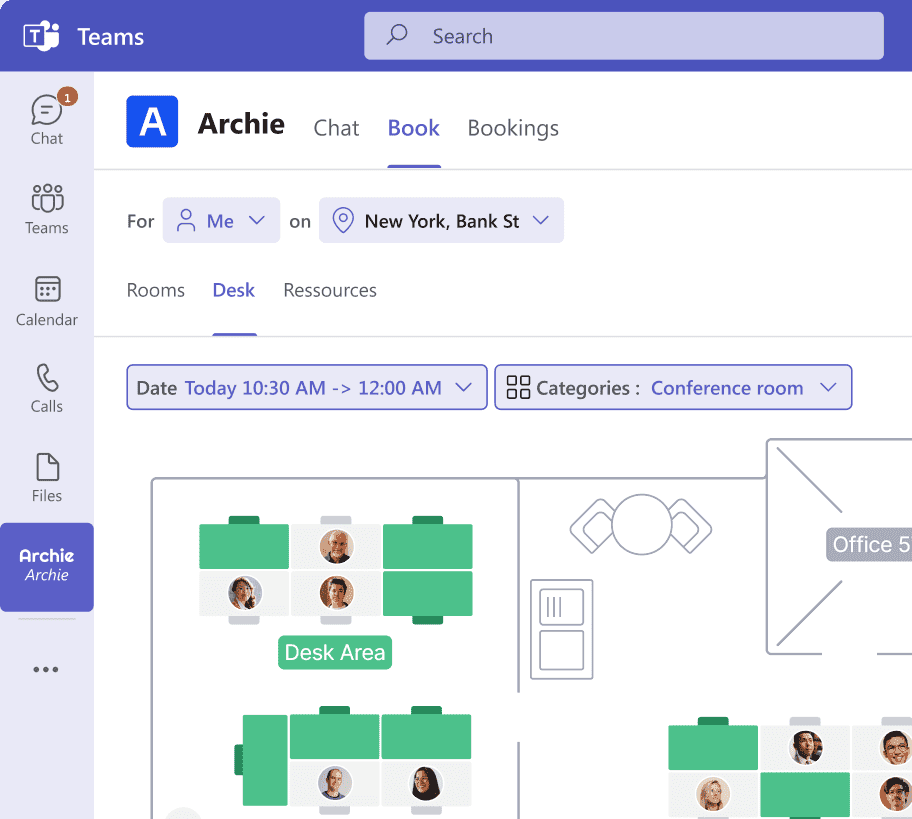
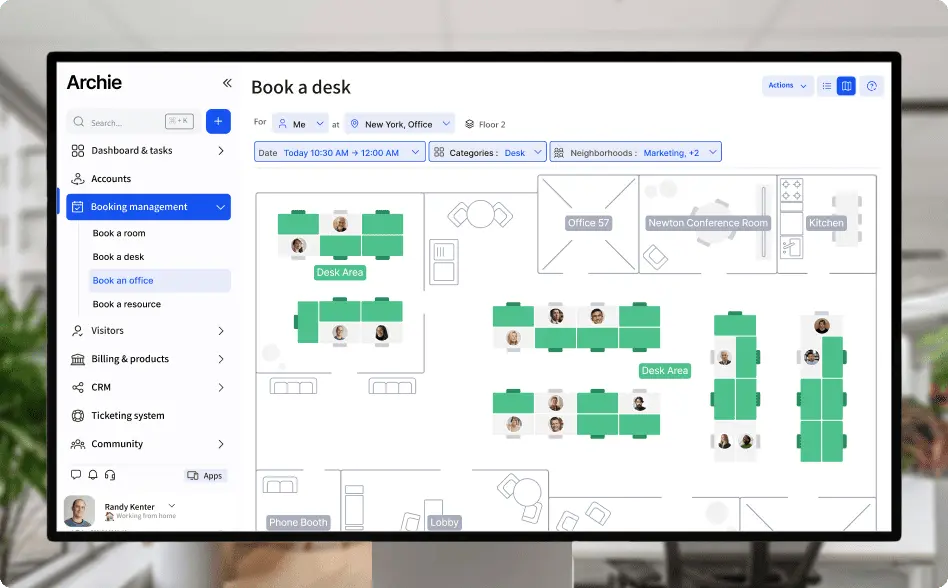
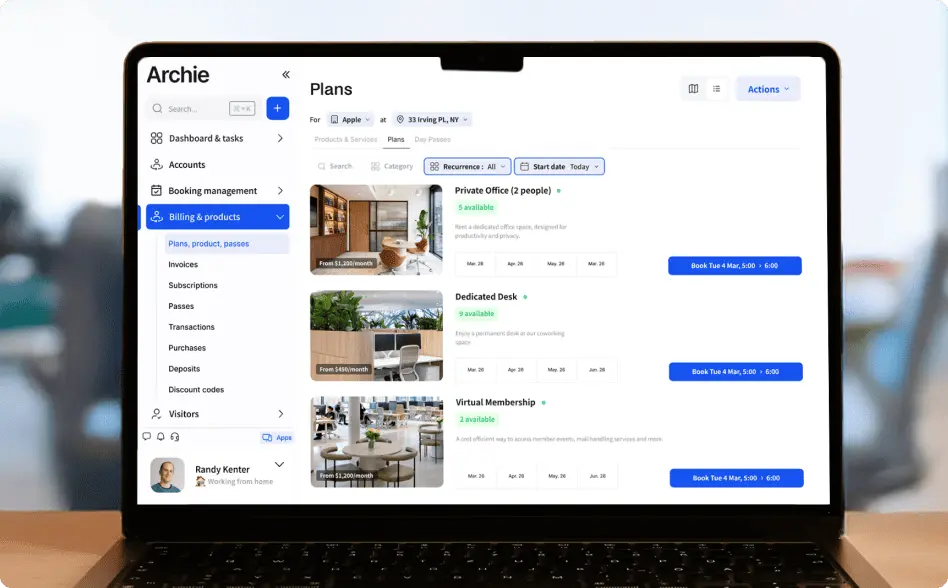
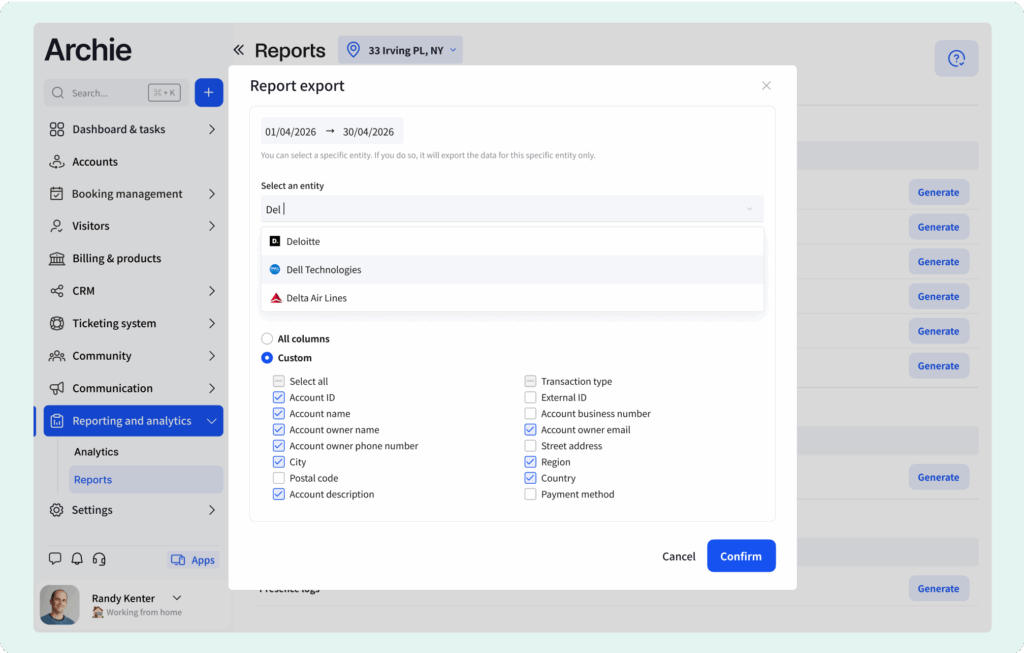
Your coworking management software, like Archie, should do the heavy lifting and help you:
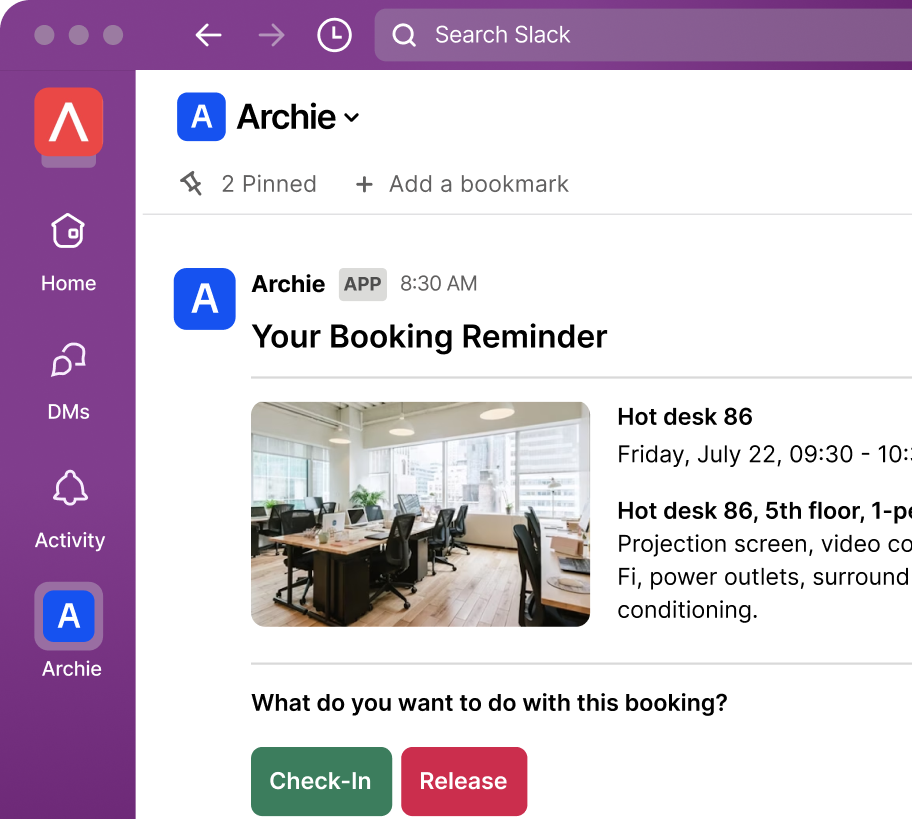
- Capture tours, bookings, and check-ins automatically.
- Block maintenance/offline hours so utilization stays accurate.
- Auto-release no-shows after a short grace period.
- Automate member onboarding.
- Add loss reasons and short notes in the coworking CRM after tours and cancellations.
- Track coworking space KPIs that matter, including: Occupancy rates, Peak days and hours, Most/least used resources and underused zones, No-show rate, late/early check-ins, and auto-release saves, Total bookings by resource type and member segment (members vs non-members/day passes), as well as Total revenue and MRR by product/service/location.
- Export reports for deeper analysis
If you’re after coworking software features like these (and more), why not give Archie a try?