


Ever wondered if you’re making the most of your office space?
I thought so.
Workplace analytics helps you track and understand office usage — so instead of guessing, you get real data on desk and meeting room occupancy, employee attendance, and office visitors, just to name a few.
Here’s everything that you need to know about workplace analytics:
Guide to workplace analytics
What is workplace analytics?
Workplace analytics is all about tracking and understanding how office spaces are used. It helps you collect and analyze data on which desks and meeting rooms are used the most, how often employees come into the office, and how teams collaborate.
The benefits of workplace analytics
- Better use of office space. Ever noticed that some desks sit empty while certain meeting rooms are always booked? Workplace analytics helps you see these patterns so you can adjust your office layout to fit how people actually work.
- Cost savings. Office space is expensive, and if parts of your office are underused, you might be wasting money on rent, utilities, and maintenance. Workspace analytics helps you identify areas that aren’t being used effectively so you can downsize unused space, introduce desk sharing, or redesign certain areas.
- An improved work experience for employees. Your employees work best in an environment that suits their needs. Some people need quiet spaces to focus, while others thrive in open areas for teamwork. Workplace analytics helps you understand what employees actually use and prefer so you can create a workspace that makes their jobs easier and more enjoyable.
- Smarter hybrid work schedule planning. Hybrid work means employees come into the office on different days, and without a clear plan, this can lead to overcrowding on some days and empty meeting rooms and desks on others. Workspace analytics tracks office attendance and helps you set up a smarter schedule. If most employees prefer coming in on Tuesdays and Thursdays, you can stagger office days or adjust desk availability to keep things balanced.
Types of workplace analytics: Predictive vs. prescriptive
Workplace analytics can be predictive or prescriptive:
1. Predictive workplace analytics: Looking ahead
Predictive office analytics uses past workplace data to forecast future trends. It helps you anticipate office needs and make proactive changes if needed.
🔍 How it works:
- Uses historical office data (e.g., desk usage, meeting room bookings, employee attendance).
- Identifies patterns and trends (e.g., which days are busiest, which desks are used most).
- Forecasts future office needs based on past behaviors.
✅ Examples of predictive workplace analytics:
- Anticipating office traffic: If workplace data shows that Tuesdays and Thursdays are the busiest days, you can plan for extra seating, adjust hybrid work schedules, or stagger in-office days.
- Predicting space needs: If meeting rooms are always full, you can add more collaboration spaces before employees start complaining.
- Planning for future growth: If analytics show a steady increase in office attendance, you can expand workspaces or adjust desk-sharing policies.
2. Prescriptive workplace analytics: Taking action
Prescriptive office analytics goes a step further. Instead of just predicting what will happen, it gives you recommendations on what to do next.
🔍 How it works:
- Analyzes predictive data and current office conditions.
- Provides specific recommendations on how to improve office usage.
- Uses AI and workplace automation to optimize decision-making.
✅ Examples of prescriptive workplace analytics:
- Optimizing hybrid work schedules: If the system detects overcrowding on certain days, it might suggest a staggered in-office schedule to spread attendance evenly.
- Improving desk & meeting room availability: If desks and meeting rooms are often booked but underused, the system might recommend a new booking policy — like shorter meeting times or automatic cancellations for no-shows.
- Reducing energy costs: If office occupancy data shows that certain areas are rarely used in the afternoon, the system could recommend adjusting lighting and HVAC settings to save energy.
Together, they create smarter and more efficient offices.
Examples of workplace analytics metrics
Here are the most important workplace data points to consider:
1. Space usage analytics
Space usage analytics tracks how employees interact with different areas, helping you make smart decisions about layouts, seating arrangements, and office resources.
It helps answer key questions like:
- How many desks are occupied each day?
- Are meeting rooms used efficiently, or do they sit empty most of the time?
- Which areas are most popular, and which go unused?
Why it matters
Tracking these patterns allows you to adjust office layouts, create more collaboration spaces, or downsize underused areas to save costs.
Key office metrics
- Total Occupancy Rate: The percentage of office space used at any given time.
- Office Capacity: The total number of employees your office can accommodate.
- Office Activity: Measures how active different areas of your office are throughout the day.
- Popular Days: Tracks which days employees come to the office the most.
- Peak Times: Identifies the busiest hours when office usage is at its highest.
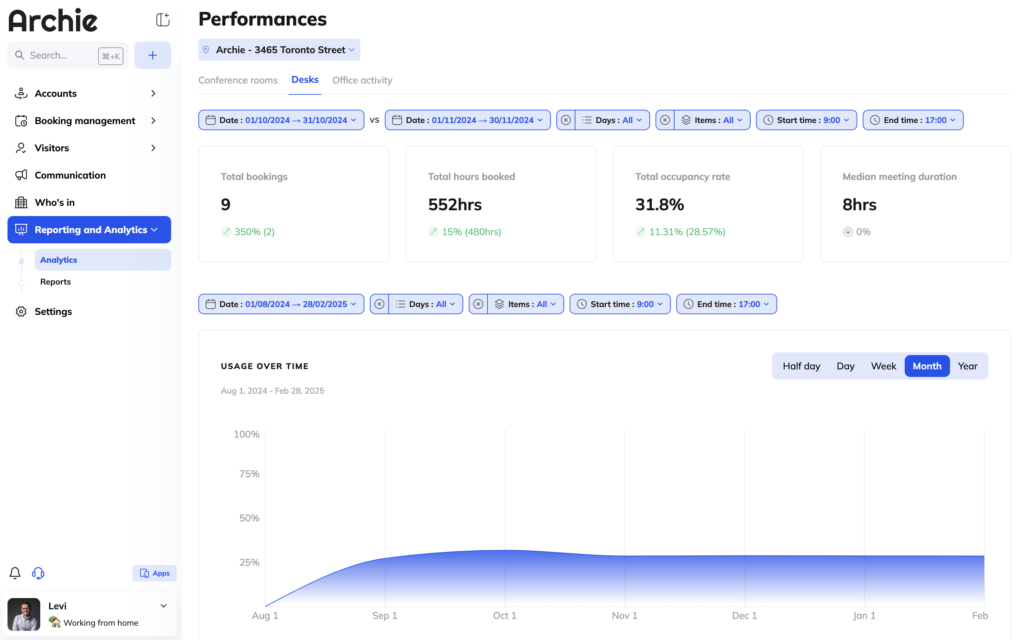
- Usage Over Time: Shows how office usage trends change weekly or monthly.
- Booked Resources: Tracks how often desks, meeting rooms, or shared spaces are reserved.
2. Desk booking analytics
If your office uses hot-desking or hotelling, workspace analytics can help you manage desks efficiently. It tracks:
- How often desks are booked.
- Who uses them and when demand is highest.
- Whether some desks remain unused while others are always in demand.
Why it matters
With these insights, you can ensure enough desks for hybrid workers and create a fair system for reserving shared spaces.
Key office metrics
- Desk Occupancy: The percentage of available desks in use.
- Employee-to-Desk Ratio: The number of employees per available desk in a flexible seating setup.
- Real-Time Desk Availability: Shows which desks are free or booked at any moment.
- Total Bookings: The total number of desk or room reservations made over a specific period.
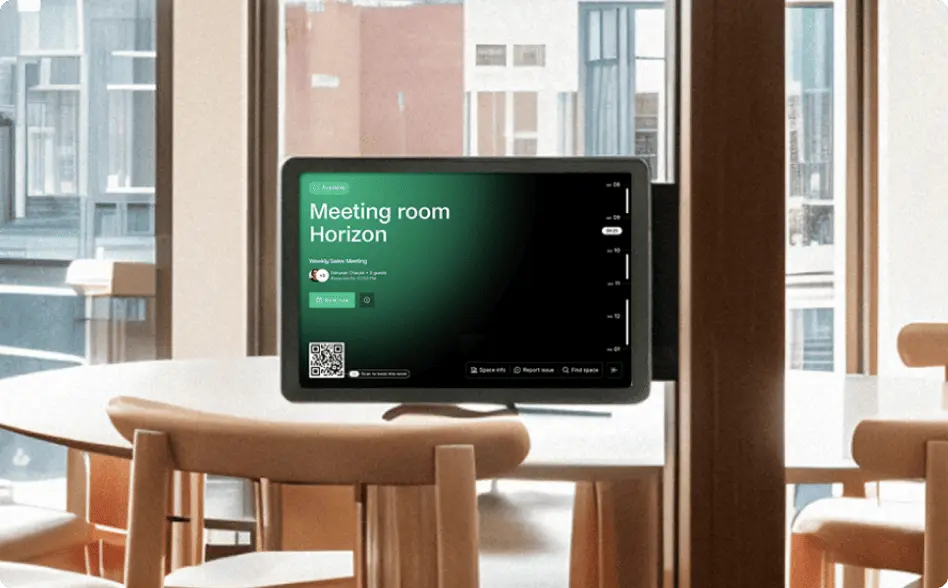
3. Meeting room analytics
Meetings take up a lot of time, but are they always productive? Meeting room analytics helps you track meeting habits and improve collaboration spaces. It monitors:
- How often meetings happen and how long they last.
- Which teams collaborate the most.
- Which meeting rooms are used the most and for what purpose.
Why it matters
If some meeting rooms are always booked while others sit empty, you can adjust availability, add more collaborative spaces, or introduce time limits for specific rooms.
Key office metrics
- Meeting Room Occupancy: Tracks how often meeting rooms are in use.
- Meeting Duration: Measures the average length of meetings.
- Total Hours Booked: The total time meeting rooms are reserved.
- Median Meeting Duration: The midpoint meeting length across all bookings.
4. Employee attendance
With hybrid work models, not everyone comes to the office daily. Employee attendance analytics helps you track office attendance patterns and optimize hybrid work schedules. It provides insights into:
- How many employees come in on different days.
- Which days are busiest and which are quieter.
- How hybrid work schedules impact office space needs.
Why it matters
Once you understand attendance trends, you can stagger office days, avoid overcrowding, and ensure enough space for those who come in.
Key office metrics
- Employee Attendance: The total number of employees who come to the office daily.
- Team Schedules: Tracks when different teams or departments are in the office.
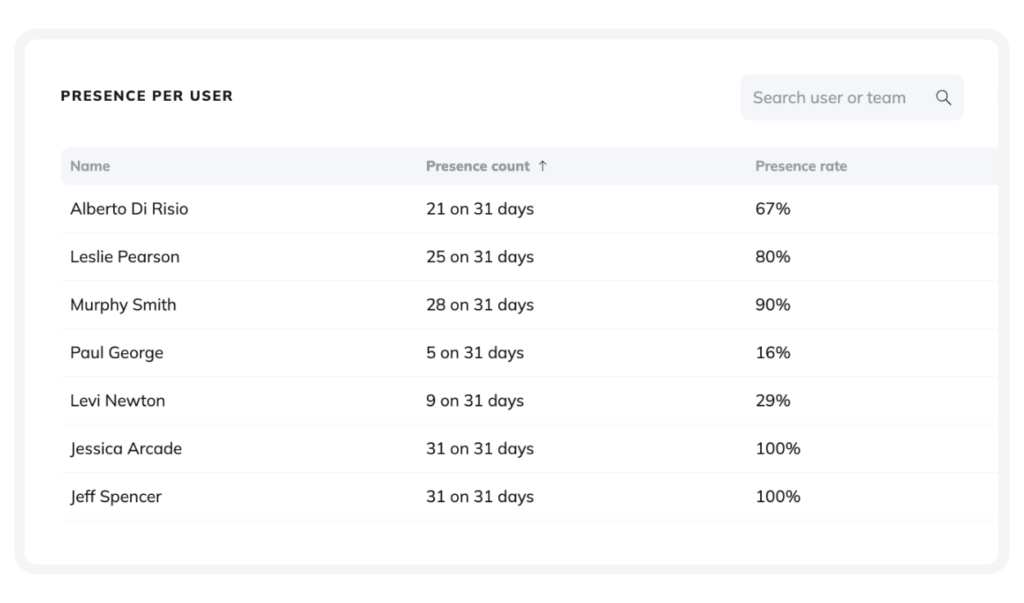
- Total Presence Rate: The percentage of employees working on-site compared to total staff.
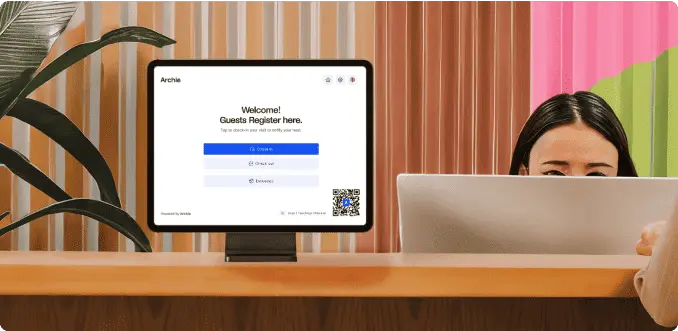
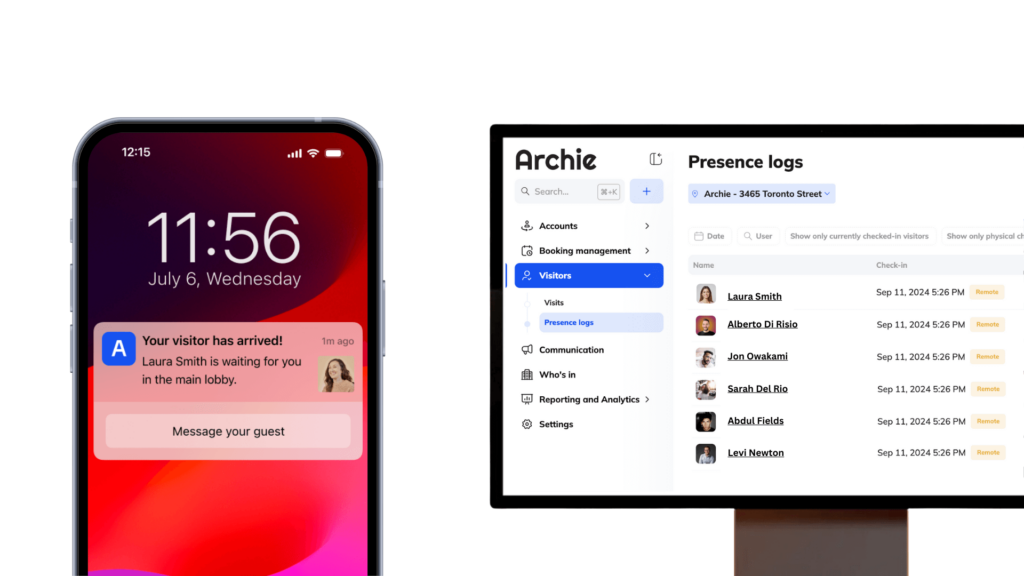
5. Visitor analytics
Do you know how many guests visit your office each day? Visitor analytics helps you manage office traffic, improve workplace security, and create a better guest experience. It tracks:
- When visitors arrive and how long they stay.
- Peak visitor times to help plan front desk staffing.
- Who is on-site at any given moment for security purposes.
Why it matters
With visitor data, you can reduce check-in wait times, enhance security, and make visits smoother and more professional.
💡 For more insights, check out the latest office security statistics →
Key office metrics
- Visitor Foot Traffic: The number of guests entering your office daily or weekly.
- Visitor Presence Log: A record of who visited, when they arrived, and how long they stayed.
Track workplace metrics with Archie
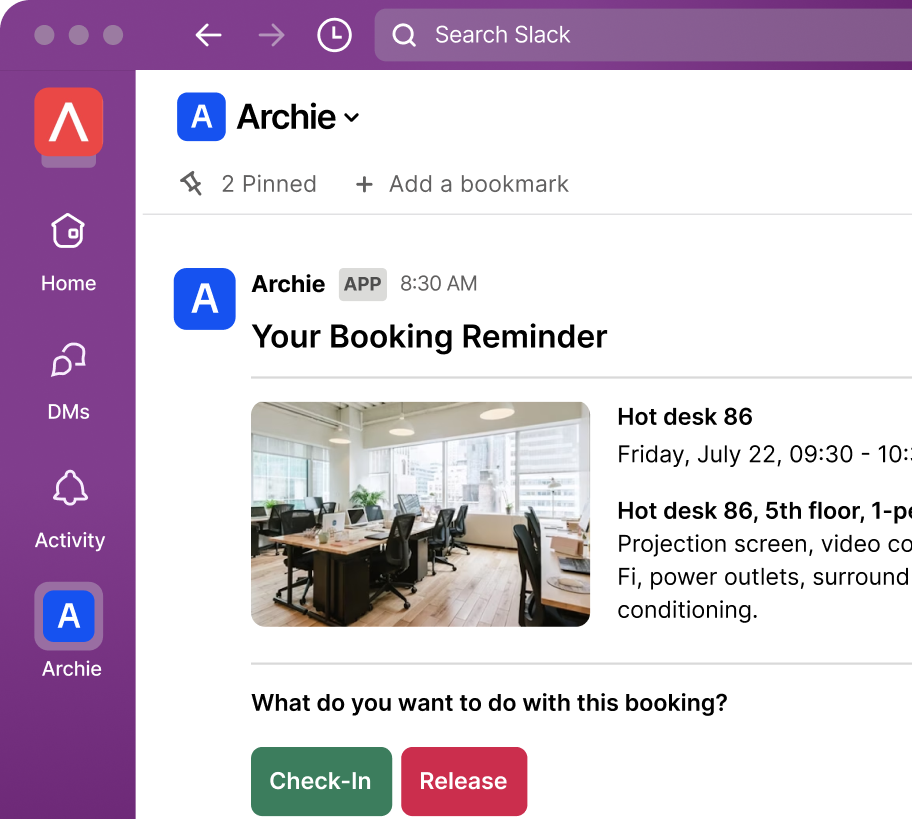
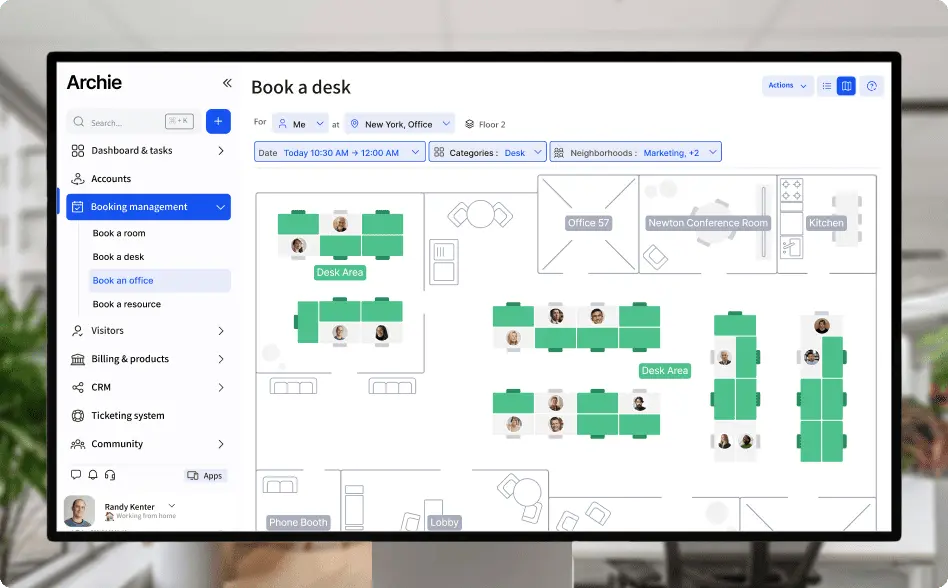
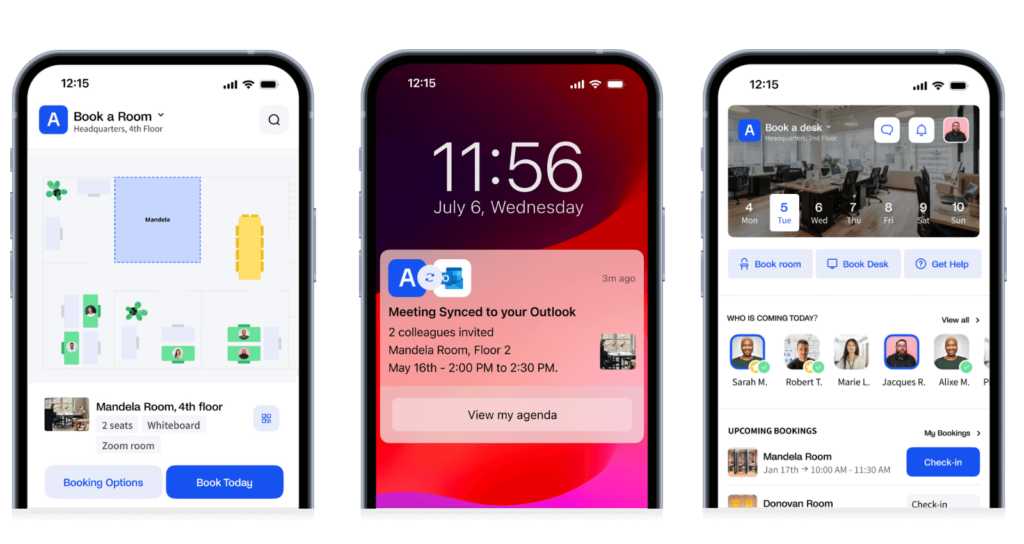
Instead of guessing how your office is being used, you can use smart workplace analytics software to track everything accurately. Workspace management tools like Archie make it easy to book workspaces, check in, and track office usage — all in one place.
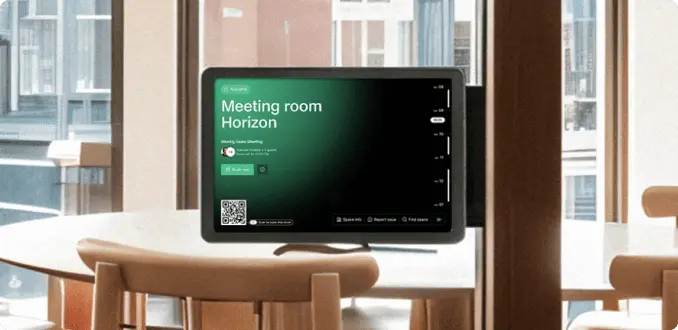
Real-time office insights
With Archie, you can see who’s in the office at any given moment and keep track of planned visits with the visitor presence log. Need to find an available desk or meeting room? The system shows which spaces are free in real time. If your company has multiple office locations, you can manage all of them from a single dashboard.
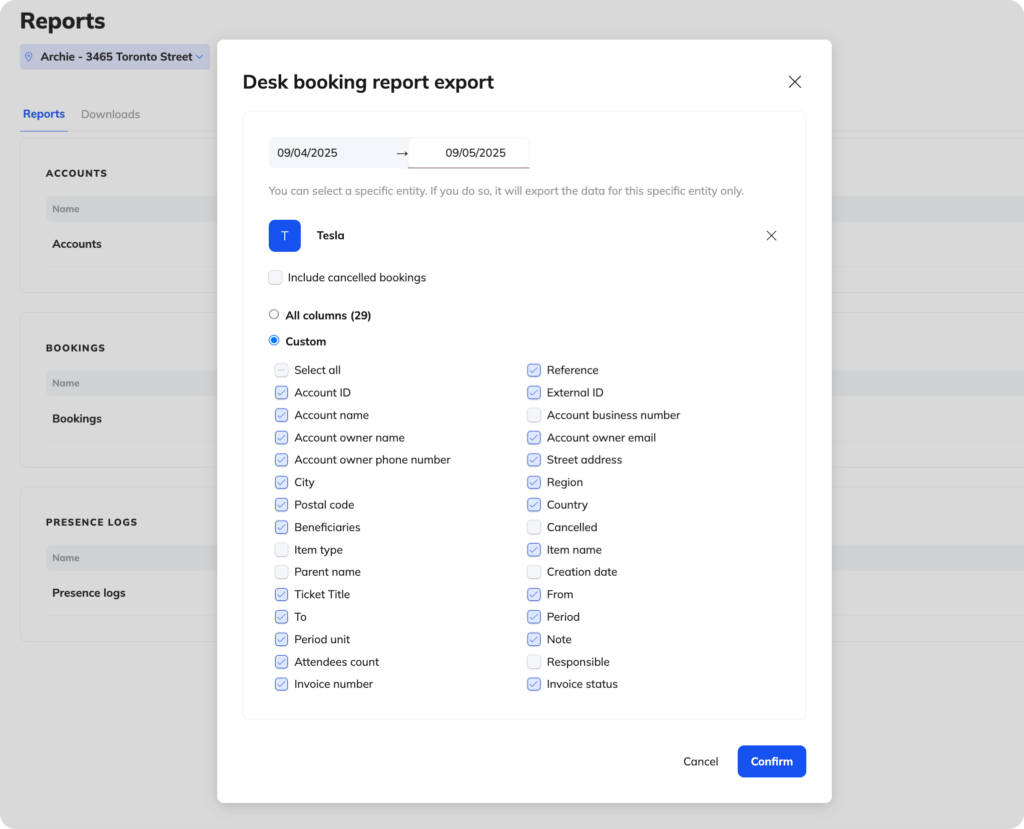
Monitor office attendance & team schedules
Archie helps you track how often employees come in and whether office attendance matches your hybrid work policy. You can see which days different teams plan to be in, monitor when the office reaches capacity, and even export workplace data for deeper analysis.
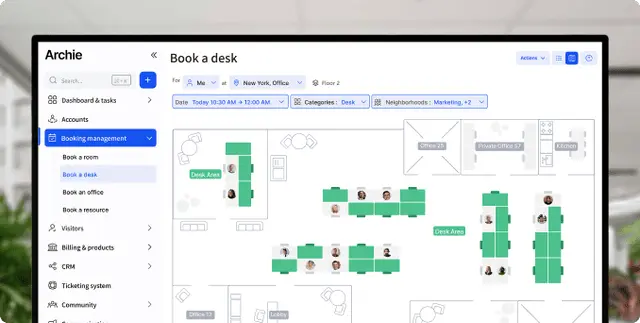
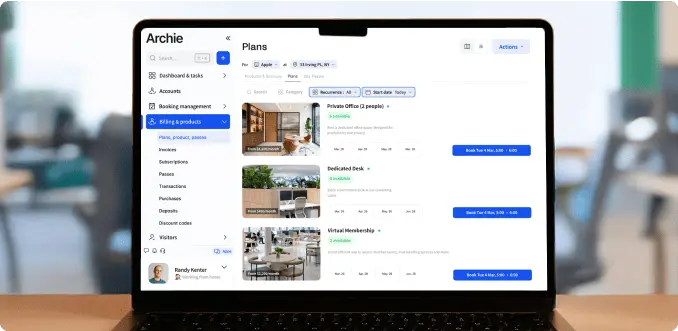
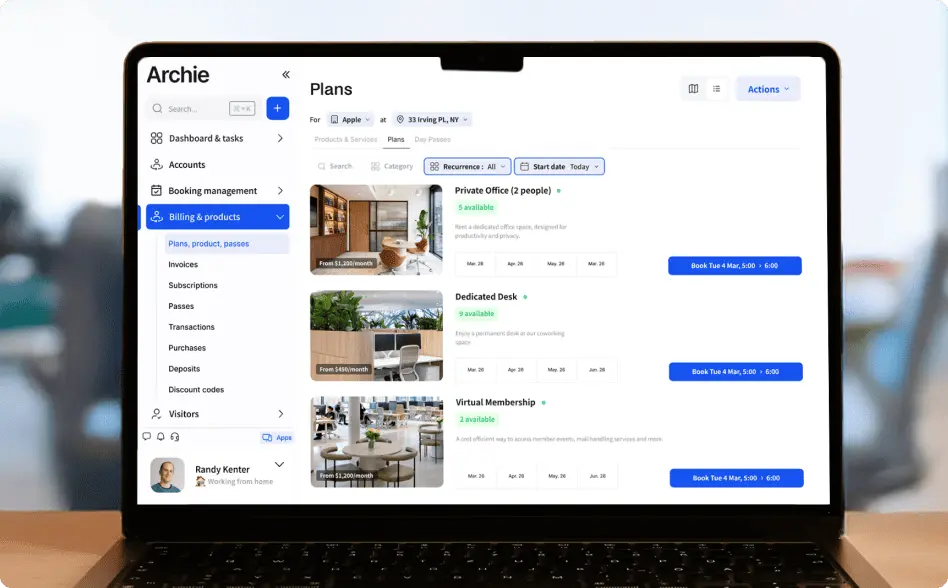
Track bookings & space utilization
With Archie, you can see which spaces are used the most and which ones go to waste. Monitor desk and meeting room occupancy, identify peak office times, and track how long resources are booked for. If certain spaces are always fully booked while others stay empty, you can adjust layouts, reassign spaces, or create new booking policies to improve efficiency.
With Archie’s workplace analytics software, you get the insights you need to create a flexible, well-optimized office that works for everyone — without wasting space or resources.
Workplace analytics FAQ
Workplace analytics helps you understand how your office space is being used so you can make smarter decisions. You can see which spaces are popular, which are underused, and how to optimize your office layout to cut unnecessary costs, and create a workspace that actually works for your employees.
Workplace analytics tracks key metrics that help you understand how your office is being used. Some of the most important ones include desk occupancy (how many desks are actually being used), meeting room utilization (which rooms are booked the most and for how long), and employee attendance (how many people come into the office and when). Other useful workplace metrics include space utilization, which shows whether certain areas of the office are overused or sitting empty, and visitor analytics, which helps track guests entering the workplace.
Workplace management platforms like Archie, Envoy, and Robin provide real-time insights into desk and meeting room bookings, office occupancy, and employee attendance. Other tools, like Microsoft Viva Insights, focus more on employee productivity and collaboration trends within your team. If you’re looking for even deeper insights, dedicated IoT sensors can track movement, space usage, and even environmental factors like air quality.
When choosing workplace analytics software, look for a tool that gives clear, real-time insights into how your office is being used. You’ll want something that tracks desk and meeting room bookings, employee attendance, peak office times, and visitor flow—all without extra manual work. A good system should help you understand which spaces are in high demand, which go unused, and how to optimize your office layout for better efficiency.
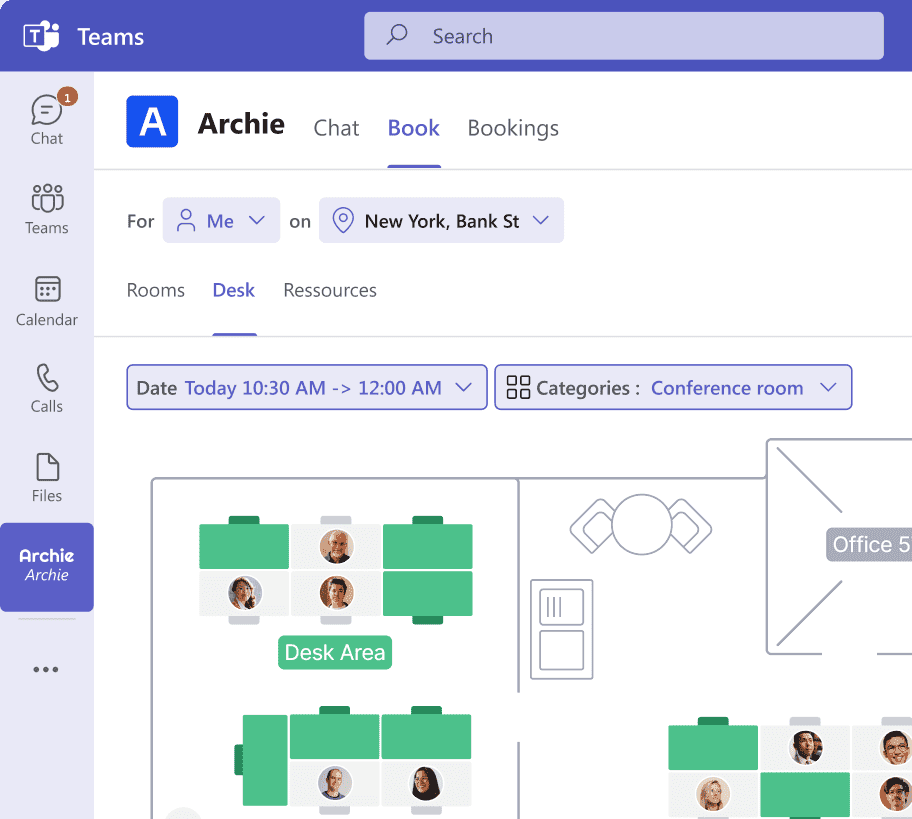
It’s also important to pick software that integrates with the tools you already use, like Slack, Microsoft Teams, or Google Calendar, so your team can book spaces and check availability with ease. A user-friendly dashboard and customizable reports make it easier to analyze workplace data and plan for the future. Archie does all this—and more.

Berenika Teter
Archie's Content Manager, fueled by filter coffee and a love for remote work. When she’s not writing about coworking spaces and hybrid workplaces, you can probably find her exploring one.


